How do we Measure That…

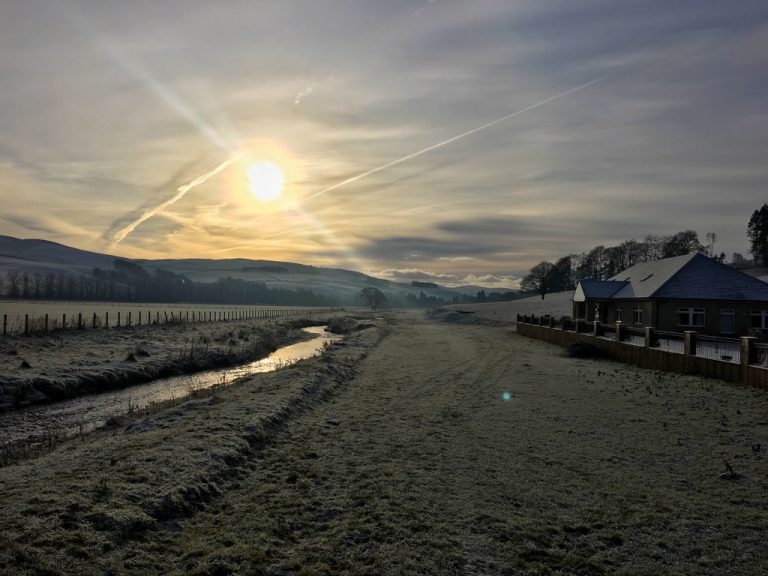
It was 9:55am and, scrolling through my emails, one particular message from Dr Andrew Black caught my attention: ‘Fieldwork Help Required Today’. It didn’t take me long to hit reply…

>1 m standing waves dowstream of Pony Bridge.

Two hours later Finlay and I were driving north on the A9 as quickly as legally possible in our tiny rental car, an ADCP (Acoustic Doppler Current Profiler) jammed in the back seats. The aim of our mission was to quantify the exceptionally high flows occurring on the River Feshie, caused by rapid melt of the snowpack (~40 mm rainfall equivalent) which fell 3 days earlier during Storm Deirdre. We followed the Spey into the Cairngorms. In some places its swirling water had overtopped the banks and here and there a couple of sheep could be seen standing marooned by floodwaters.

SEPA had estimated peak flows of 107 cumecs at their Feshie Bridge gauging station and, as we drove up into Glen Feshie, it became apparent that, if anything, their estimation was conservative. Murky water roared down the glen, tugging at vegetation and cutting into the river banks. We stood uneasily on the Pony Bridge, the standing waves downstream over a metre high! Upstream, fresh erosion could be seen on the high outside banks of the meander and, as we tied ropes to the ADCP, a tree shot past, borne along by the floodwaters.  Neither Finlay or I had ever attempted to gauge flows in conditions quite like this and soon found out first hand just how much power water has.

Big boat, little car.
Preparing the ADCP for launch.

The ADCP emits sound waves and utilises the doppler effect to capture the flow velocities throughout the water column and generate a profile of the river bed. The device must be dragged across the width of the river to obtain a reading and, equipped with several lengths of orange rope, we stationed ourselves on opposite banks. However, with the ADCP in the water, it very quickly became apparent that pulling it across in such high flows was going to be difficult and we hauled it in before it could be swept downstream. Slightly upstream, we found a wider section of river with lower flow velocities.

Ropes at the ready.

However, keeping the long ropes out of the water proved impossible and, once the river had hold of them, it wouldn’t let go! No matter how hard we pulled, the ropes stayed put and gradually slipped through our hands and further downstream! Eventually Finlay waved his arms… it was no use. I let go and, with a snap, the rope leapt from the bank and vanished downstream (it was thankfully tied to a tree on the other bank). At this stage we admitted defeat and packed up our kit. The SEPA gauge downstream at Feshie Bridge had recorded a peak flow of 141 cumecs.

High water under the bridge.


It was an opportunity missed and, in hindsight, there may have been other ways to get the data we were after. Although significantly less high tech, we could have played Poohsticks with twigs, timing their journey down a measured section of river to estimate water velocities across the channel. A river bed profile could then have been obtained another day in more benign conditions. However, now that river levels have fallen again, debris lines left behind by the flood could perhaps be mapped to reconstruct what was going on in the river that afternoon.

Chilly for flow gauging

It was minus 10 C when our Eddleston field hydrometrist Boyd set off for his work this morning – but the work must go on!  Indeed some flow meters might not cope with such temperatures, but our Flow Tracker – and Boyd – seem able to cope with the conditions.  Low temperature gaugings let us keep check on ratings when ice/snow build-up may affect channel conditions and water levels.

Extreme conditions often produce the most memorable photos – so glad there was some added benefit arising from your determined efforts, Boyd!  I am happy to confirm it was very warm in my office this morning 🙂