
Post by Laura Young
Every year, April 22nd – Earth Day serves as a reminder of the fragility of our planet and the urgent need for environmental action. This year, the theme “Planet vs Plastic” reminds us that although the problems with plastics are well known, we still struggle with plastic pollution and excessive use of this oil-based material. Slowly, action has been taken addressing pointless plastic problems; bags, straws, cotton buds, however a new concern has emerged: single-use disposable vapes. These devices continue to soar in popularity, posing both sustainability and public health challenges.
The first Earth Day dates back to 1970, when millions of people mobilised under the banner of environmental advocacy. Since then, it has evolved into a yearly reminder of what we want to conserve, prompting individuals, communities, businesses and governments to evaluate their environmental impact and commit to positive change. Yet, despite decades of awareness and activism, the issue of plastic pollution persists as one of the most pressing environmental crises of our time.
Plastic can be fantastic, for durability, or keeping important medical appliances sterile, however when this material is overused and abused we begin to see problems. In particular, single-use plastic has become engrained in our everyday lives, almost everything we package our food in, wear, or use in our homes is made from plastic. It’s cheap and convenient but comes with a big cost to the environment. Plastic waste litters our parks, beaches and oceans, contaminates our soil, endangers wildlife, and has now been detected in the human body. The detrimental effects of plastic pollution are far-reaching, threatening ecosystems and human health.
This year’s theme “Planet vs. Plastic” is yet another plea for action. Efforts to reduce single-use plastics, promote recycling, and develop sustainable alternatives have gained momentum globally. However, just as progress is being made in one area, new challenges arise in unexpected forms.
Enter single-use disposable vapes. These sleek, portable electronics devices have surged in popularity in recent years, particularly, and worryingly, among young adults, teenagers, and children. Originally a smoking cessation device for adults trying to quit tobacco cigarettes, disposable vapes are marketed as a convenient and discreet, offering a seemingly effortless way to quit smoking. However, beneath their attractive exterior lies a hidden environmental menace.
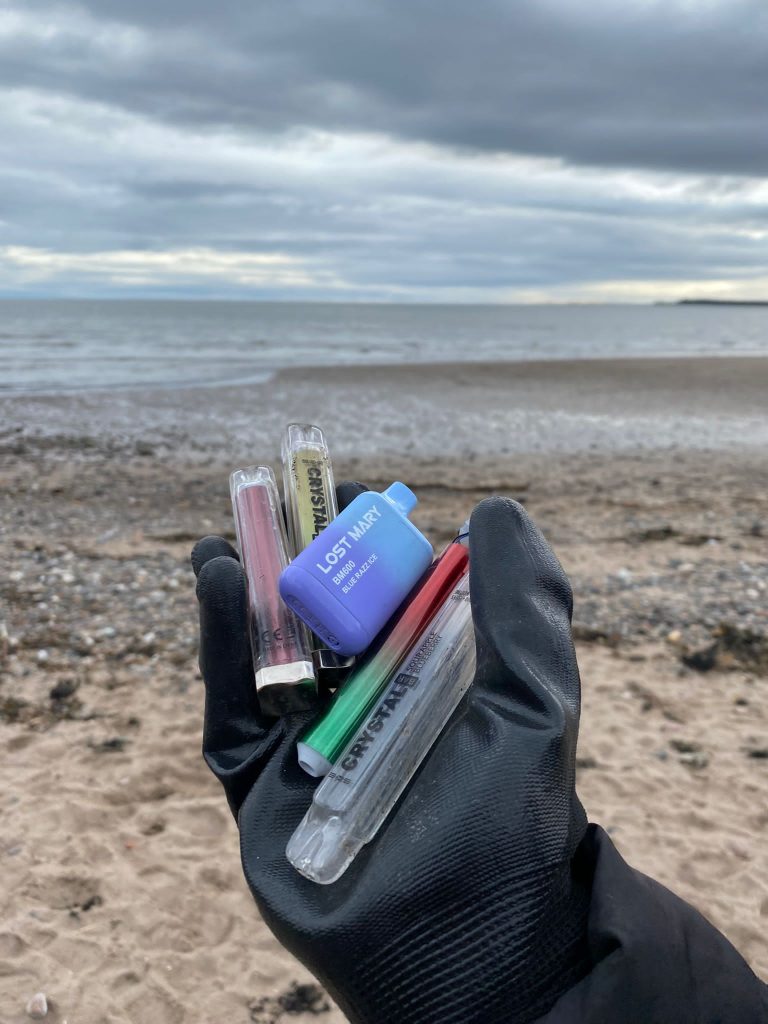
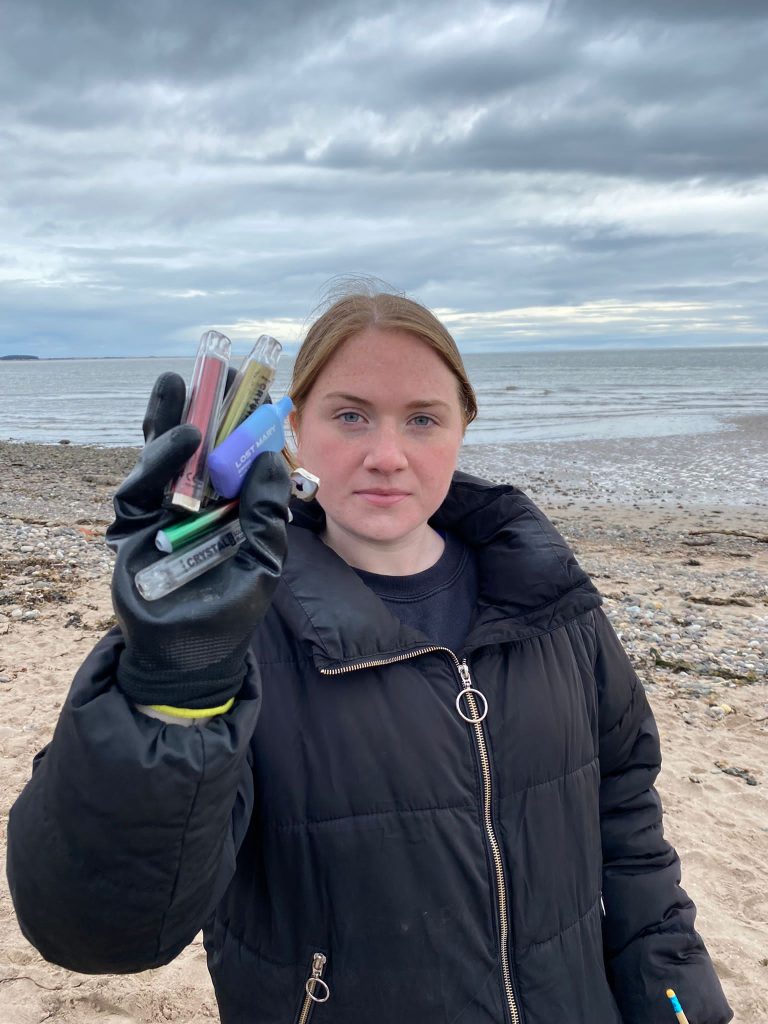
Unlike refillable, rechargeable, and reusable e-cigarettes, disposable vapes are designed for single-use and are discarded after the battery is depleted or the e-liquid runs out. This convenience throwaway culture has led to a proliferation of vape-related waste, with millions of vapes ending up in landfills each year, and many littered on our streets. It is estimated that the UK throws away 5 million per week (Material Focus, 2023). These electronic devices are packed full of critical materials such as lithium, cobalt and copper, and are packed neatly into colourful tubes containing multiple types of plastics. Plastic nozzles, sponges, casings, wire coverings and paint coatings are just a few ways single-use plastics are engrained in these devices, much of which is non-recyclable. Continuing to produce non-recyclable plastic demands continued new fossil fuel extraction while landfills build up and incineration plants continue to burn plastic-based products, contributing to climate change.
The environmental impact of disposable vapes extends beyond just physical waste. The production and disposal of these devices contribute to carbon emissions and resource depletion, putting a strain our planet’s finite resources. Additionally, many chemicals in e-liquids pose potential risks to human health and the environment, showcasing the interconnected nature of many environmental and public health issues.
Addressing the rise of single-use disposable vapes requires a multi-faceted approach combining regulation, education, and innovation. Governments must regulate the production, sale, and disposal of these devices, including measures to restrict youth access and facilitate collection and recycling. For many that means looking to already existing legislation and tightening monitoring, evaluation and enforcement. However, for many this means going further. In the UK, legislation is in the process of being debated in the lead up to the 1st of April 2025 when single-use disposable vapes will be banned, alongside other tobacco and nicotine regulations. This builds on progress from other countries like New Zealand and Australia, and influences other nations like the EU who are looking to take similar action. However, in the interim, educational campaigns are needed to raise awareness of both the environmental and health impacts, empowering communities to make informed choices.
This Earth Day, when considering “Planet vs. Plastic”, I hope we look beyond just eliminating single-use plastics, but look beyond to challenge the culture of continued disposable consumption that drives society today. Whether it’s plastic bags, straws, or disposable vapes, we must confront the current throwaway mindset that underpins modern life. We must reimagine our relationship with consumption and waste to build a more sustainable future for generations to come.


